Since the May 10-11 aurora superstorm, a frequent question we have received is “what makes a good report? What makes a good photo?” While all reports are amazing, the answer may surprise you! In this post we’ll walk you through things to include, go behind the scenes on how data is cleaned for scientific use, and give some examples of how you are making a difference. Most of all, we are grateful to everyone for participating in Aurorasaurus!
If you want to learn more, we would love for you to join us at our next Report-A-Thon: Sat, Sept 21, 1-4 pm EDT. It’s a fun, online social we hold twice a year to celebrate our amazing volunteers and do participatory science together. You can help gather data to advance aurora science, ask your questions to experts, and hang out with a community of aurora lovers. Register at https://bit.ly/reportfall24.
How to Make a Report
ALL reports are useful! Both positive reports (that you have seen aurora) and negative reports (that you have not seen aurora) are important. They help determine things like how far away the aurora was visible, how well models predicted the event, and whether factors like light pollution or clouds made the aurora hard to see. Report photos don’t have to be perfect—some of the most interesting were captured on the fly when the aurora did something unusual!
Click here for a quick-start video on how to make reports to the website. Web reports can be made in real time, or backdated. Multiple reports can be made per day. You can make an account or report anonymously, but we prefer that you log in. With an account, you can see all of your reports and receive our monthly newsletter. Logged-in users also receive two different kinds of aurora notifications by email: one when a model predicts aurora near you, and one when other users actually see aurora near you. When you make your report, you will have the following options to add scientifically valuable information to your observation. We work to make the reporting process easy for you, useful as a real-time map, and scientifically valuable as archived data.
Most important: place, time, and date
Location
Data marking where the aurora is visible from the ground is important for several reasons, not least to help refine models. Our website maps a version of a widely-used aurora model called OVATION Prime, which shows where aurora is expected to be overhead and calculates a red “view line” at which it should be visible from the side. Models need to be confirmed by observations, though, and your reports serve as “ground-truth” validation of the view line. Sometimes, Aurorasaurus participatory scientists—like you—report auroras beyond the calculated view line. Once the website reaches a certain amount of reports past the view line, our version of the model reworks the view line to include these observations.
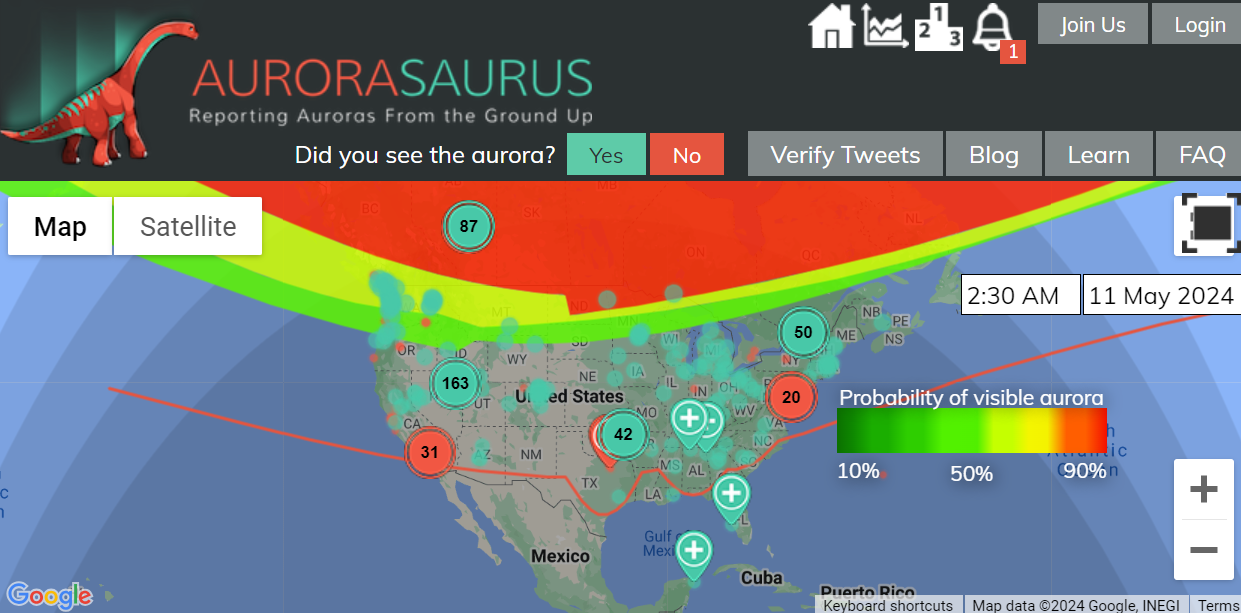
This data can also help refine other models and help with studying space weather. Note: For privacy reasons, locations are automatically fuzzed by a random amount up to 1 kilometer as soon as they are entered by the user.
Time and Date
The aurora is constantly moving and changing, and it’s very helpful for scientists to have data that captures the same moment from different locations. Doing so can help with studying interesting features or calculating the altitude of different parts of the aurora. In order to match up your sightings with other reports and scientific data, we need an accurate measure of when you saw the aurora. If you are submitting photos, please synchronize the time on your camera to an accurate clock like your phone. This helps with accurately matching photos taken at the same time from different locations.
You can make your report in your own local timezone; the site will show your local time, and data times will be standardized when they go into the database. You have choices about how to report the duration of your observation: you can make one report for the whole observation, or report in 15-minute increments. We recommended making the duration 3 hours or less. When we clean data, reports longer than 3 hours are generally filtered out, since they may contain errors or not be specific enough for analysis. It can be helpful to double check the time and date before submitting your report, especially to make sure that the end time is correct and the report didn’t accidentally cover multiple days.
We love real-time reports, and they are very helpful during aurora events, but even if you aren’t able to report in real time your observations are still important.
Helpful but optional: tell us more
Features
There are a few other questions in the reporting form: what colors did you see, what type of aurora did you see, where in the sky and how active was it? These are all optional, but help reconstruct the event and contain scientifically valuable information that can be separated into useful categories for analysis. For example, if a researcher is particularly interested in red auroras, they will be able to use the data from the “what colors did you see” field to pull out observations to analyze. Generally speaking, the more info the better, but if you can’t get to it, that’s okay too.
Additional Comments
These fields are your opportunity to tell us more about what you observed. Did STEVE make an appearance? Did you observe a cool shape or something unusual? Did you notice sounds, changes in animal behavior, or something else when the aurora appeared? Do you want to add details to any questions you were unsure of how to answer? Please note that while we meticulously clean our data before publication, it’s still better to avoid putting personal information like emails or addresses into this field. If you have questions, please feel free to reach out to us by email at aurorasaurus.info@gmail.com.
Photos
Photographic data is one of the strongest ways that participatory scientists can gather data, and we are grateful for any photos! They do not have to be refined–in fact, while we prefer RAW and unprocessed images when possible, any kind of photo makes a good addition to a report. You can upload any type of image file, and there is no file size limit. A shot of STEVE, a picture through clouds, an image of an aurora’s most active time, a back of camera pic, an unusual phenomenon: anything could have important information within it. The aurora changes quickly and rare phenomena like auroral beads can occur rapidly. Photographers have advantages in capturing these kinds of events. For example, it can be very difficult for stationary scientific cameras to observe aurora on cloudy days, but aurora chasers are agile and can make successful observations despite things like cloud cover.
When you submit a report, you agree to our Terms of Use, which were written to inform and collect data with consent for research use. A major goal for the Aurorasaurus project is for the resulting dataset (including photos) to be made available for research use and collaboration. We only publish anonymized data and protect your privacy. Please read the full Terms for further descriptions of how we use your reports.
Please note that while the website does not currently have a way to upload timelapses, videos, or bulk photos, you can reach out to us by email for alternatives.
What Happens to the Reports?
Your reports show up on the website, including mini thumbnails of any images you submitted. The reports are also gathered into a database. Aurorasaurus analyzes the data, and our datasets are cleaned for public distribution. This takes time, as the reviewers go through the data by hand, point by point. It also means that you don’t need to worry about “messing up” a report, as any potential errors will be caught and removed from the dataset. You can see our first data release, published as .csv files on Zenodo. We are working on cleaning more, especially for the May 10-11, 2024 storm. When the data is cleaned and released, we will notify everyone via our monthly newsletter.
Aurorasaurus participants have already made a difference by submitting reports. A few additional examples:
- In 2015 we showed activity on Twitter grew with the size of an aurora storm, so it was exciting but not surprising to see the massive response to the large May 10-11, 2024 event.
- In 2018, in collaboration with participatory scientists and scientists, Aurorasaurus published the first modern paper about STEVE, the optical manifestation of an extreme SAID. There will likely be new discoveries to come, as there are lots of science questions that can be explored using this data.
- We have been eagerly anticipating the massive imaging potential for this solar maximum, with smartphones capable of photographing the aurora. You all made that a reality! After the May 10-11, 2024 storm, we realized that we had not ever even imaged a superstorm with digital photos. Back in 2003, during the last superstorm, most people did not even have digital cameras, let alone smartphones!
Thank you!
The participatory science at the heart of Aurorasaurus is only possible because of the amazing volunteers who turn their passion for the aurora into reports for science. While this post has gone into detail on ways to add more data into a report, we are grateful for all aurora reports whether made by new participants or regulars. Thank you for being part of Aurorasaurus!
Don’t forget to register to join us at the Report-a-Thon! There will be prizes (including aurora altitude hats!)


