First, thank you for being part of the Aurorasaurus community. Every observation you have shared has helped build something remarkable.
We’re excited to announce the release of more than a decade of Aurorasaurus citizen science data. To make this resource as useful as possible, Dr. Liz MacDonald and post-bachelor researcher Feras Natsheh have further refined our data-cleaning protocols to identify incomplete, duplicate, and other extraneous reports, creating a curated dataset that is ready for scientific research and community exploration alike.
They have also developed a free suite of visualization tools that anyone can use to explore 11 years of aurora observations and discover patterns in this extraordinary community-created record. In this post, we’ll share what is included in the release, how the dataset was prepared, and how you can start exploring it yourself.
Quick start links
- A paper detailing the database and tools (preprint link)
- Data set: Aurorasaurus Web Observations (2014-2025)
- Jupyter Notebooks for exploring the data with code
- Zenodo open science “aurora citizen science” community that anyone can share or tag to join
Data release and paper
This technical report “Crowdsourced Aurora Observations During Geomagnetic Superstorms: The Aurorasaurus Open Science Database” details Aurorasaurus citizen science data from the lifetime of the project. There is a particular focus on observations collected during the two major geomagnetic superstorms of 2024, which produced the highest report volume in the project’s history. These storms coincided with the Heliophysics Big Year of October 2023–December 2024, a NASA-led, global celebration of the Sun’s influence on Earth and the solar system. Aurorasaurus took part in the initiative through a variety of activities, which encouraged participants to engage with the Sun in as many ways as possible at the nexus of citizen science, eclipses, and solar maximum.
The report also presents updates to the project’s data filtering protocols and scientific data release pipeline. Aurorasaurus crowdsourced observations are submitted via the project’s website and mobile platforms, forming a robust dataset that is especially abundant during intense geomagnetic storms when traditional auroral precipitation models are most uncertain. This dataset is offered to the scientific community in both raw and scientific formats through an open-access repository. The methods and transformations applied to produce a scientifically usable version of the dataset are documented in detail in this paper.
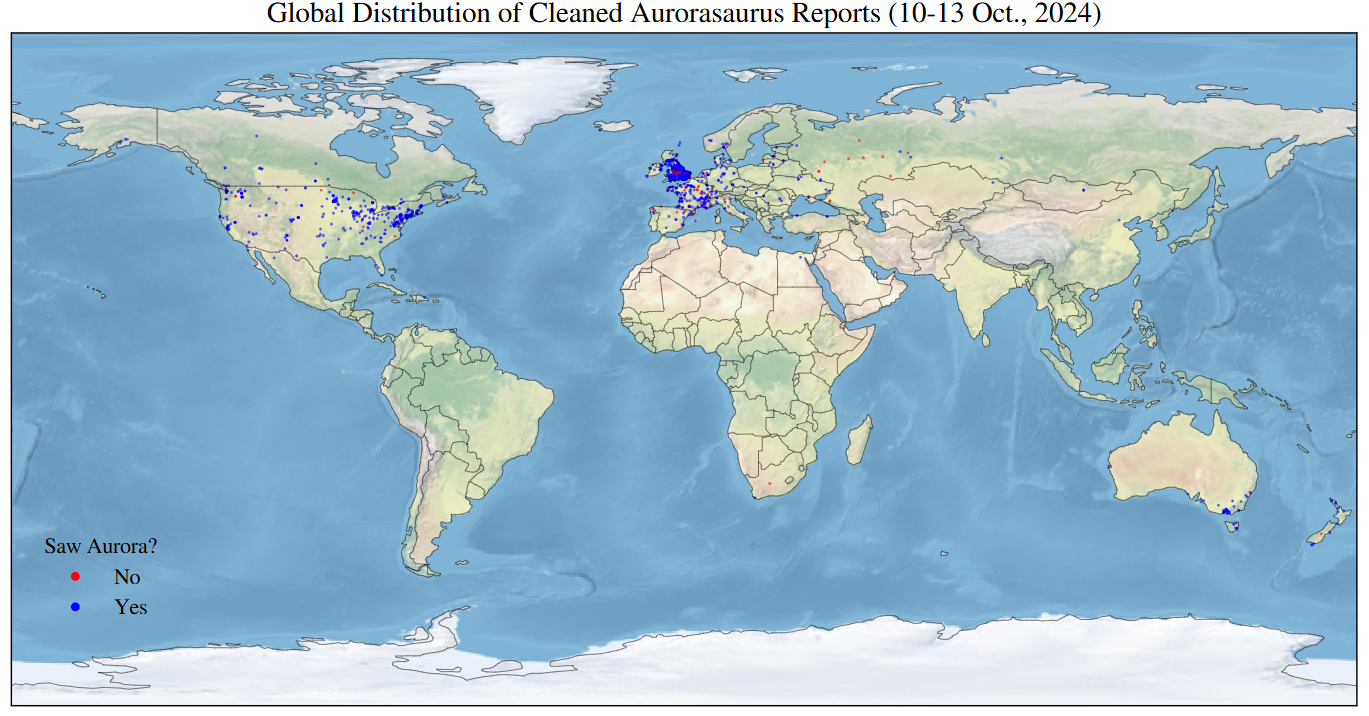
Aurorasaurus has been in operation since September 2014, and prior data was released for the early years of the project, summarized in Kosar et al., 2018. We now build on those efforts, including Python code for data cleaning and scientific use. During the Gannon May 2024 storm, we received 6,415 reports: to our knowledge, the largest number of global participatory sightings ever reported for a single event (see figure below). For the October 2024 storm, we received 1,589 reports. We were also excited to see that in these recent storms, more reports contained photos, possibly reflecting how camera and smartphone technology have advanced over the last decade.

Preparing the data
To make the dataset ready for scientific use, we put it through a processing pipeline, written in Python (and double-checked by us humans):
- Data transformation: we remove or redact spam, test reports, and personally identifiable information
- Data cleaning: we filter the data for scientific usefulness, removing
- Reports longer than 12 hours
- Reports with sky conditions that are cloudy, light polluted, or bright from the moon. Since obscured views can’t confirm or deny whether aurora was visible, we are primarily looking for negative reports that note a clear view of the night sky (with most further scientific uses)
- Duplicate reports
- Advanced analysis and visualization: we can further filter the observations down to those that are less than three hours for comparison with scientific geophysical data. We also produce visualizations and statistical summaries for study.
With this preparation work completed, the dataset is ready for you to explore. More details are in the paper of course, and both ‘transformed’ and ‘cleaned’ data are available.
Early findings
We found some cool things after applying these protocols to the May (Gannon) and October 2024 superstorms. For example, reports provided more detail in October than in May, but May had many more reports overall. While both storms were very colorful and active, observers noted differences in color, activity, location, and types of aurora. In the chart below, you can see comparisons between the two storms in each of these categories:

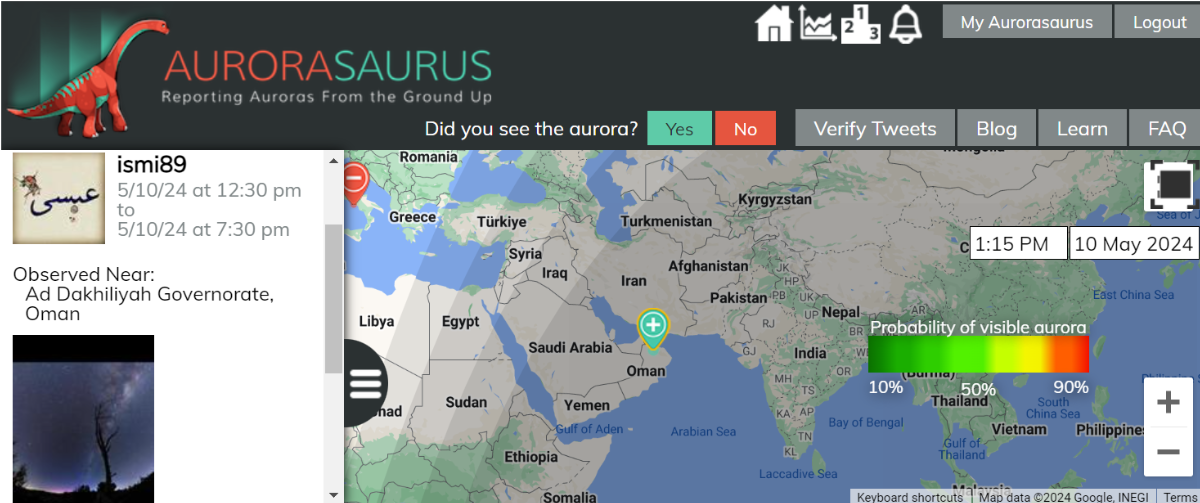
There have also been some astounding individual reports: for instance, an extremely low-latitude report from two astrophotographers in the Sultanate of Oman during the Gannon storm. They had been taking night sky photography in a dark sky site near 18°N magnetic latitude, and realized that they might have captured unusual red emissions with their cameras. They contacted a NASA enthusiast and English translator in Oman, who in turn got in touch with Aurorasaurus. Dr. Liz and citizen science colleague Michael Theusner confirmed that the images seemed to be red aurora, and that the time, location, and astrometry of their observations were consistent with one of the peaks of activity well-documented across Europe.
As we discuss in the paper, auroral color is a result of layered chemical processes in the upper atmosphere and provides an important clue to understanding the energies, altitudes, and processes of specific auroral forms. Citizen science reports that include colors are an important aspect of the Aurorasaurus dataset and provide critical scientific information. When the aurora extends to lower latitudes there are fewer scientific-grade, multicolor cameras to document it, so large storms have never been fully imaged. In addition, the largest superstorms are rare, so the intricacies of the physics behind the unusual aurora types and colors of the 2024 superstorms are not well understood. The two superstorms had differences in color profiles:


Viewers around the world observed red auroras: long-lasting SAR arcs, time periods of great red aurora, and some over-the-horizon red aurora. Some locations saw multiple types at different times throughout the night, and some saw them at the same time but in different parts of the sky. They also noted incredible magenta aurora, and more unusual aspects and combinations of these types. These observations were possible because of the contributions of citizen scientists, aurora chasers, photographers, enthusiasts, and members of the public. Research is ongoing as part of the larger scientific process, and there are more details in our paper.
Tools to explore the data
Jupyter Notebooks are free, open-source software tools that let users write and run free Python code, create data visualizations, and share interactive analyses in a single document. It requires some coding experience, but it’s much simpler than other methods. Jupyter Notebook is built with its own assistant tools that help with coding and make the notebooks even easier to use. Our data release includes interactive, open-source Jupyter Notebooks that walk you through the steps you need to enable exploration, visualization, and comparison of auroral observations and their geographic locations. By providing beginner-level ways to explore the data, we aim to encourage the integration of Aurorasaurus citizen science data into space weather research by scientists and non-scientists alike.
Things to consider
As with any dataset, there are caveats to think about when analyzing data. Carl Sagan once wrote, “absence of evidence is not evidence of absence.” There’s a lot to learn from the presence of aurora reports, but we caution against drawing conclusions about the average distributions of aurora. For example:
Aurora reports reflect perspective, population bias, and conditions like light pollution
When people report aurora, they may be beneath it or viewing the lights from the side at a distance. In other words, aurora reports reflect the locations (and populations) from which people report, so they aren’t the same as the absolute abundance of where aurora was.
The aurora can be present but not visible
The aurora occurs hundreds of miles above the ground—far above things like clouds, rain, snow, and light pollution. “No” reports are important, and negative reports on nights when the sky was clear and aurora might have been visible are especially scientifically valuable.
What can we learn together?
Since its publication last month, we’ve been so excited to see the many ways that citizen scientists and students are delving into this decade of data. If you’re interested in learning more, check out the paper to learn more about the released data, how it was analyzed, and how the storms compare; as well as Dr. Liz MacDonald’s recent presentation to the Aurorasaurus Ambassadors:
Shout out to Aurorasaurus user and our Science Activation colleague Deanna, who is exploring the data for a class and building a case study to help her find STEVE in her area. If like Deanna, you dive into the data, we’d love to know! Drop us an email at aurorasaurus.info at gmail.com to tell us what you find. Let’s learn more together!


